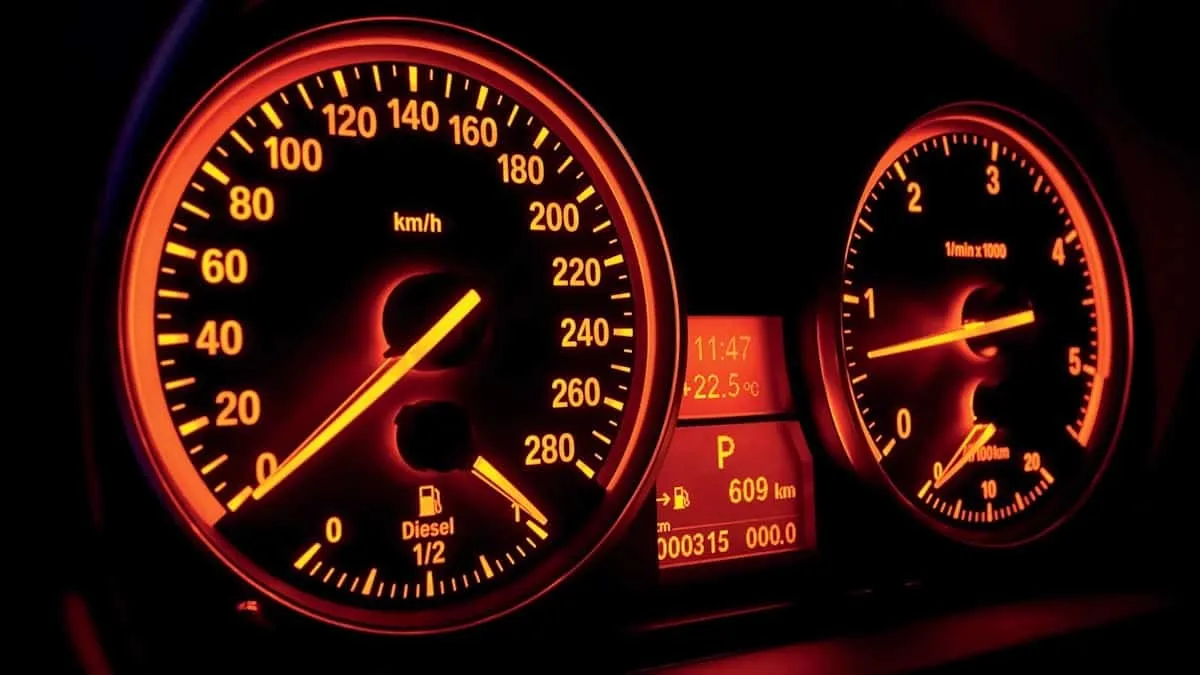
Since the invention of the car, instrument clusters have largely consisted of a speedometer, tachometer, fuel gauge, and engine temperatures. With increased reliance on software and cheaper digital displays, most clusters are now digital, enabling carmakers to display more complex information.
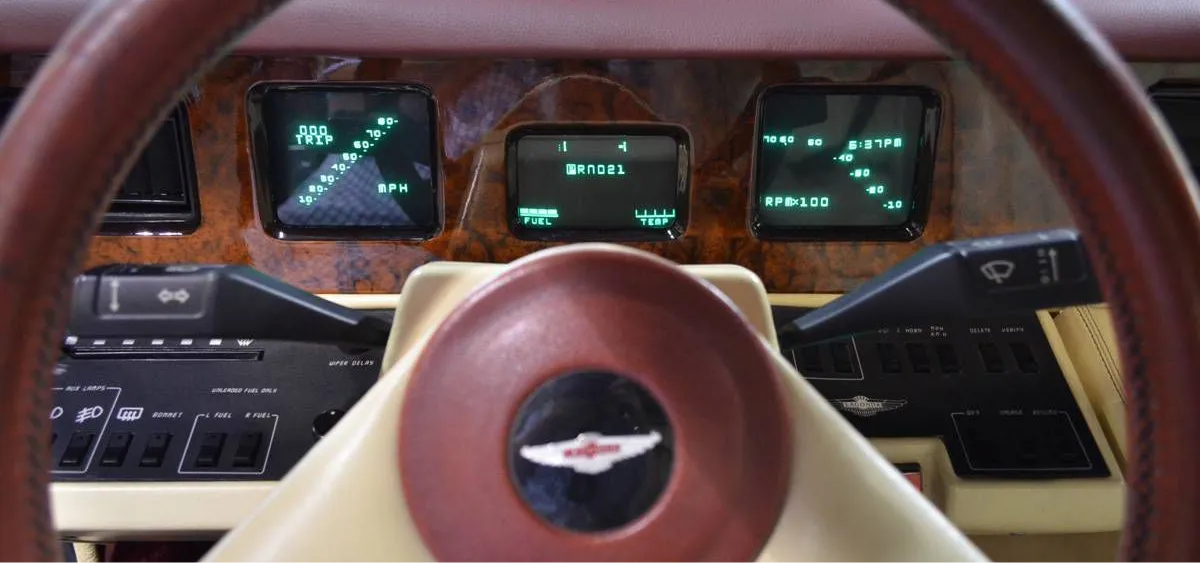
Like the first touchscreen, the first digital cluster is older than you may think, debuting on a 1974 Aston Martin Lagonda.
Although the digital dashboard almost bankrupted Aston Martin, it now serves primarily as a cost-saving measure. A single digital display is cheaper than multiple analog gauges, and software offers more flexibility and shorter development times.
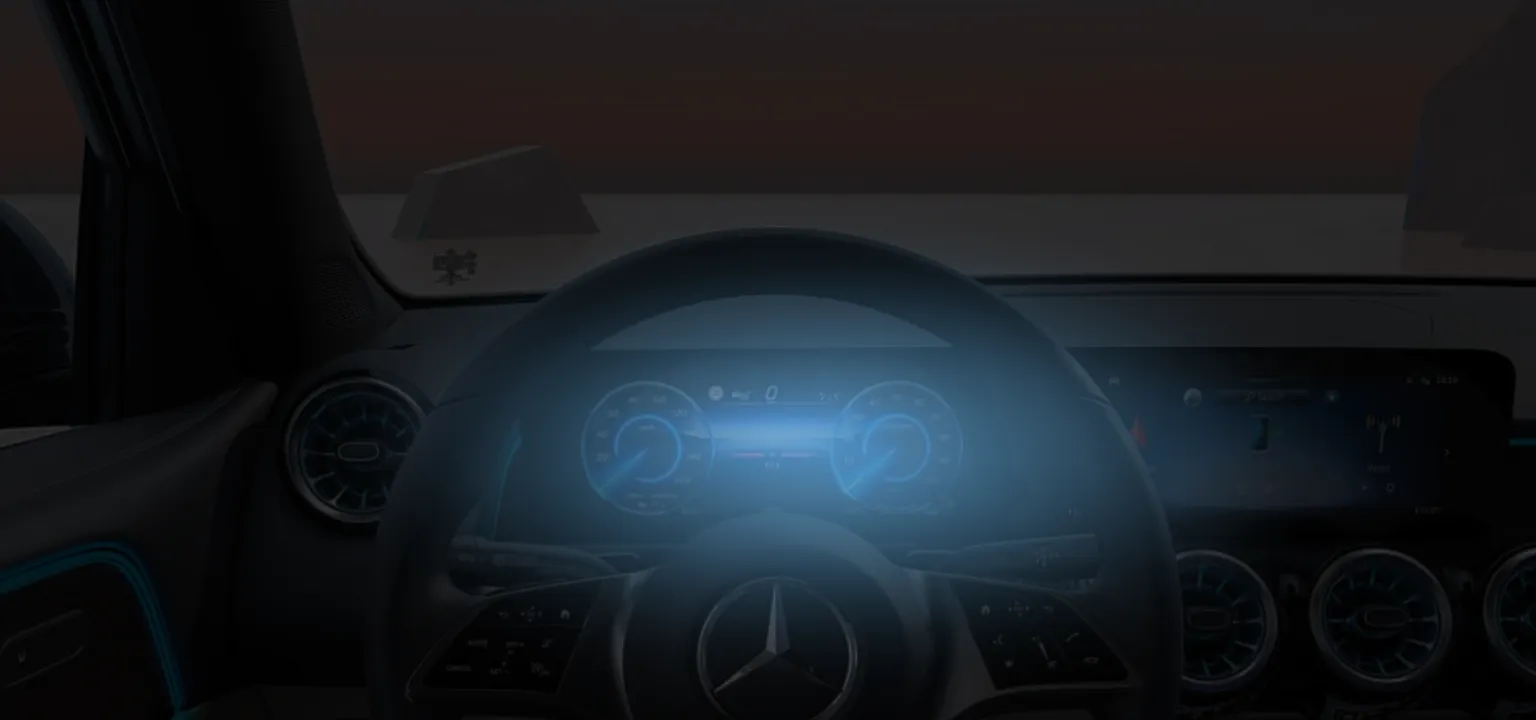
However, much like digital infotainment systems, the lack of physical limits lets carmakers add excessive features, complicating the interface. Most carmakers can’t match their analog instrument clusters in terms of quality. A prime example is the Mercedes EQA I tested recently. The simple, minimal analog instrument cluster of the first-generation A-class contrasts sharply with its modern counterpart.
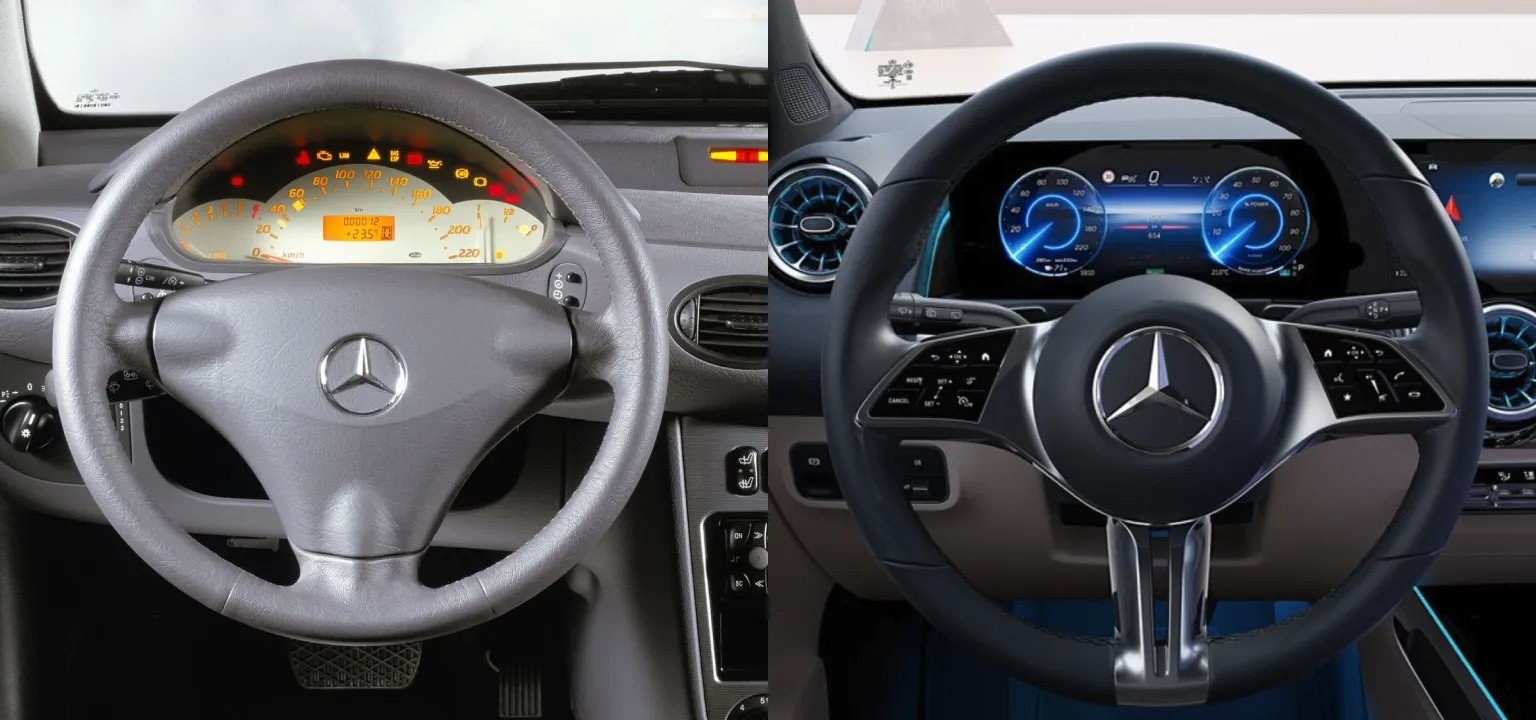
What was once a static display has become a configurable carnival with over 40 cluster layouts, adjustable via steering wheel buttons. Moreover, the displays are of poor quality, so with Mercedes’ UI theme, driving at night involves constant blue light shining in your face.
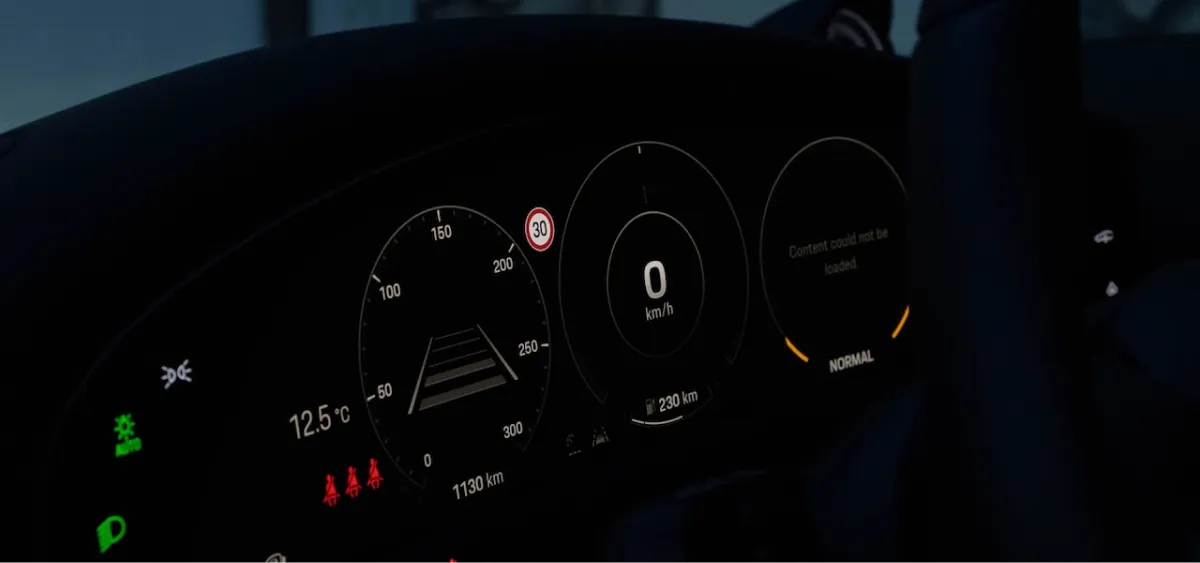
Driving at night in a Porsche Taycan is a different experience. It features a more expensive OLED display, and the designers used a pure black background, making it much more comfortable in low-light conditions. A digital instrument cluster does not have to imply a step back in ergonomics.
Though, like Mercedes, the Taycan also offers excessive configurability with numerous cluster layouts and widgets, complicating the interface.
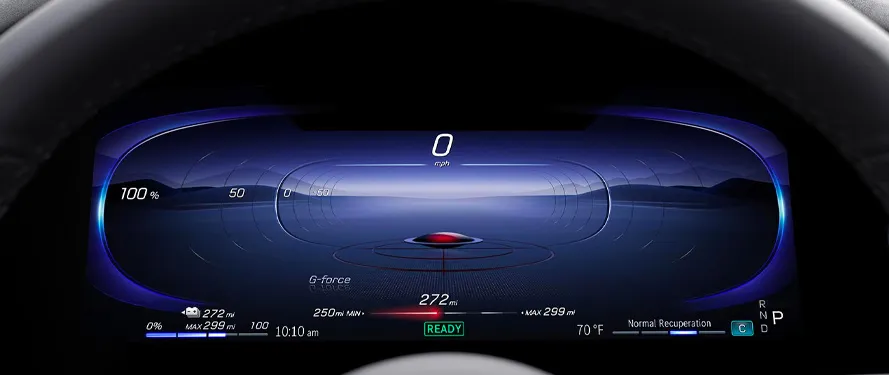
Carmakers may boast about the number of layouts and widgets, but adding features to digital interfaces is easy. A flying disk measuring G-force surely creates an ‘experience’ in the Mercedes EQS, but is it good design? I think not. It simply adds an unnecessary feature with a net negative effect on system complexity.
Configurability and limitless features are not the way to get the most out of digital instrument clusters. Disregarding cost, do digital clusters offer design advantages, and can they match analog clusters? With time to kill over the holidays, I explored these questions by trying to design a digital instrument cluster interface from scratch.
Constraints
Critiquing existing instrument clusters is easy, but the truth is that designing them is incredibly difficult. What seems easy is actually a complicated piece of technology with many constraints.
1. Dealing with physical constraints
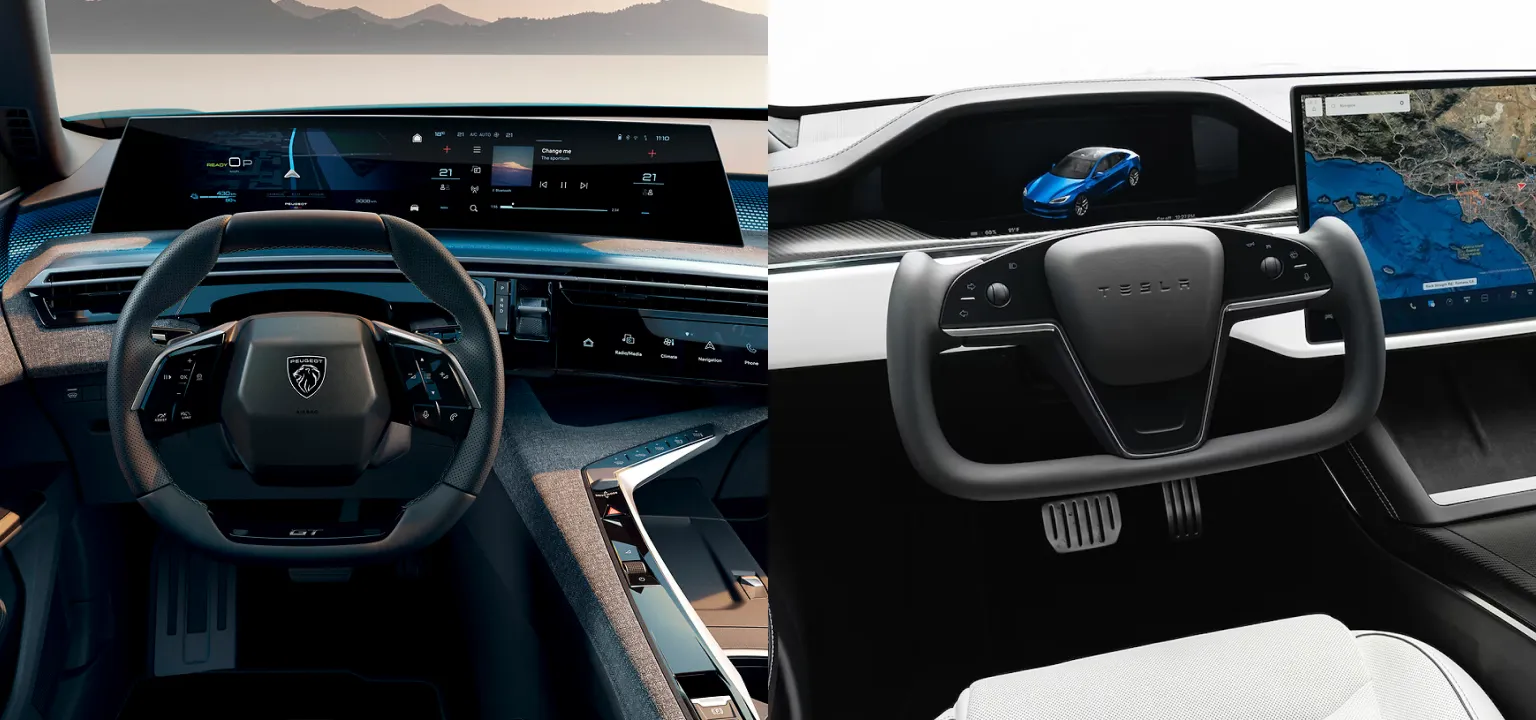
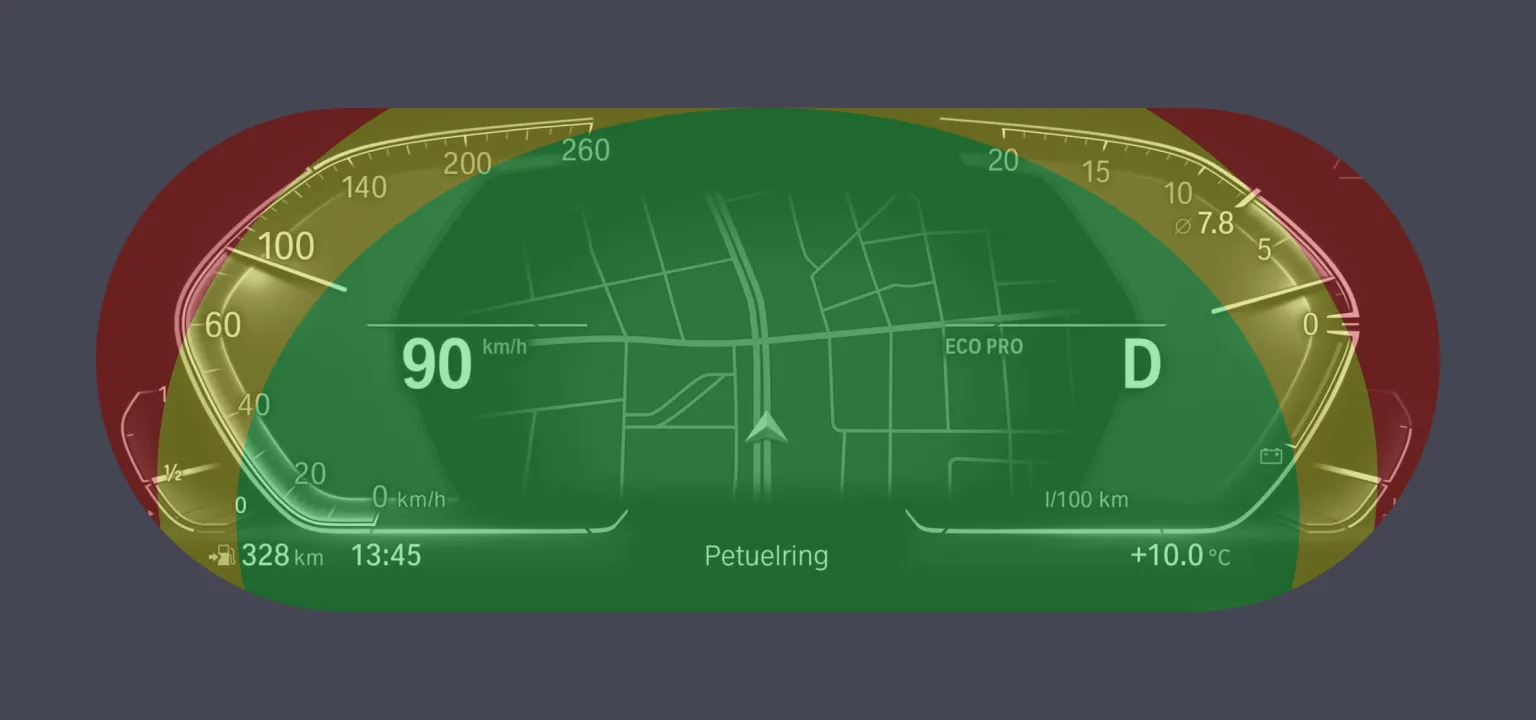
The first constraint arises before even touching the interface. Ensuring visibility is a big challenge. Drivers of all sizes must see the display and find a comfortable seating position at the same time. Moreover, external factors like sunlight can cause reflections or damage the display. Finding a setup that works is difficult, leading some carmakers to try unconventional interior layouts.
Typically, it is not possible to ensure perfect visibility on all areas of the display. This means the designer has to take this into account when designing the interface.
2. Regulations
Unlike infotainment, instrument clusters must adhere to various regional standards and regulations dictating information, permissible lag, and other safety-related factors.
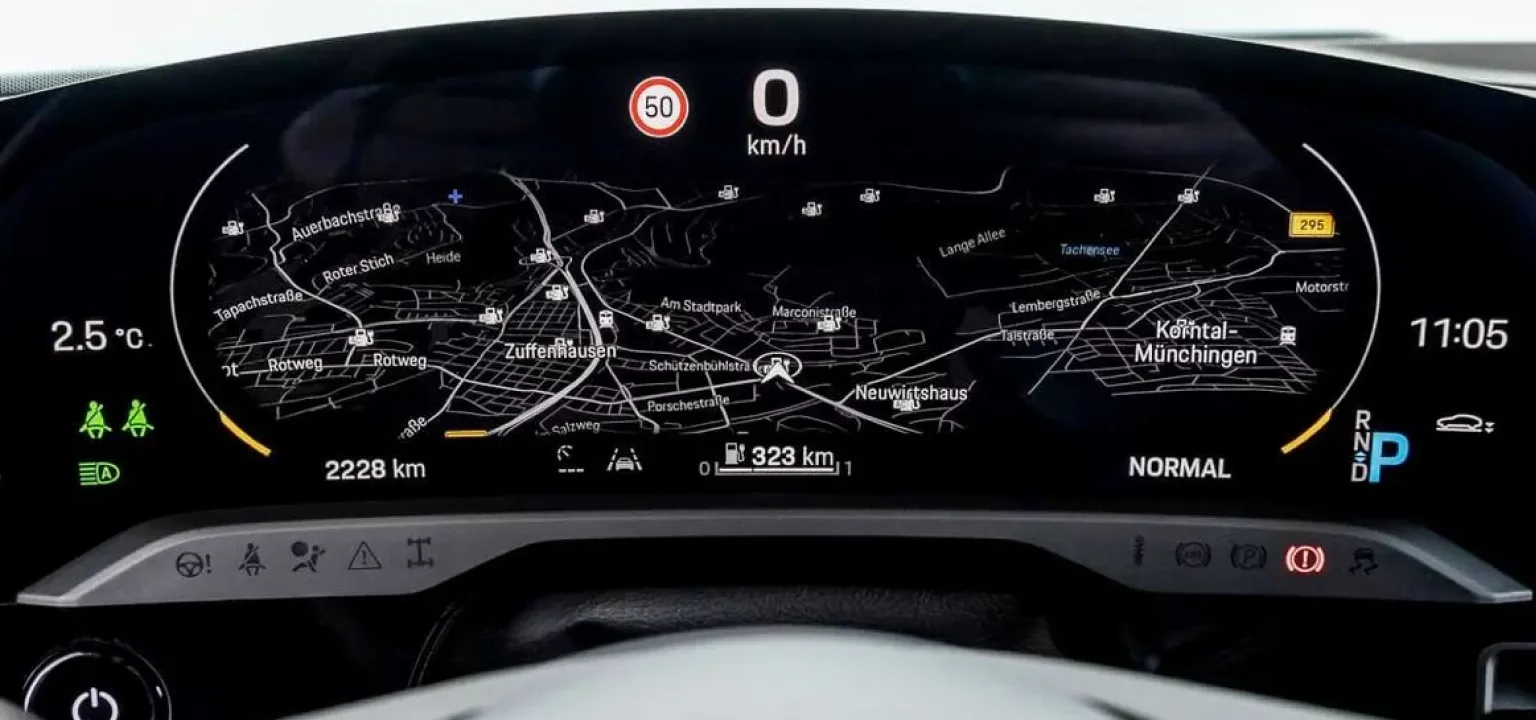
One important constraint for designers is the ‘tell-tales’, the warning icons. Although few drivers know their meanings, each carmaker must ensure an icon is displayed without fail, with minimal lag, and without obscuring other information. They take up significant space in the instrument cluster. Porsche found a clever way around it by adding a panel below the digital display.
3. Technical complexity
The instrument cluster’s technical complexity stems from its safety-critical nature. Essential information such as speed and warning icons must be fail-proof. The real-time operating system, often BlackBerry’s QNX, typically handles that information, while other information like navigation may run on Android or Linux. Consequently, various software systems can power the instrument cluster simultaneously, imposing additional constraints on designers.
These three constraints cover only broadly what designers face. Each carmaker has more specific restrictions. Since I’ve given myself just a few days to design, I don’t consider them. However, I highlight these to show my design is merely a concept, not a finished product. Let’s jump in!
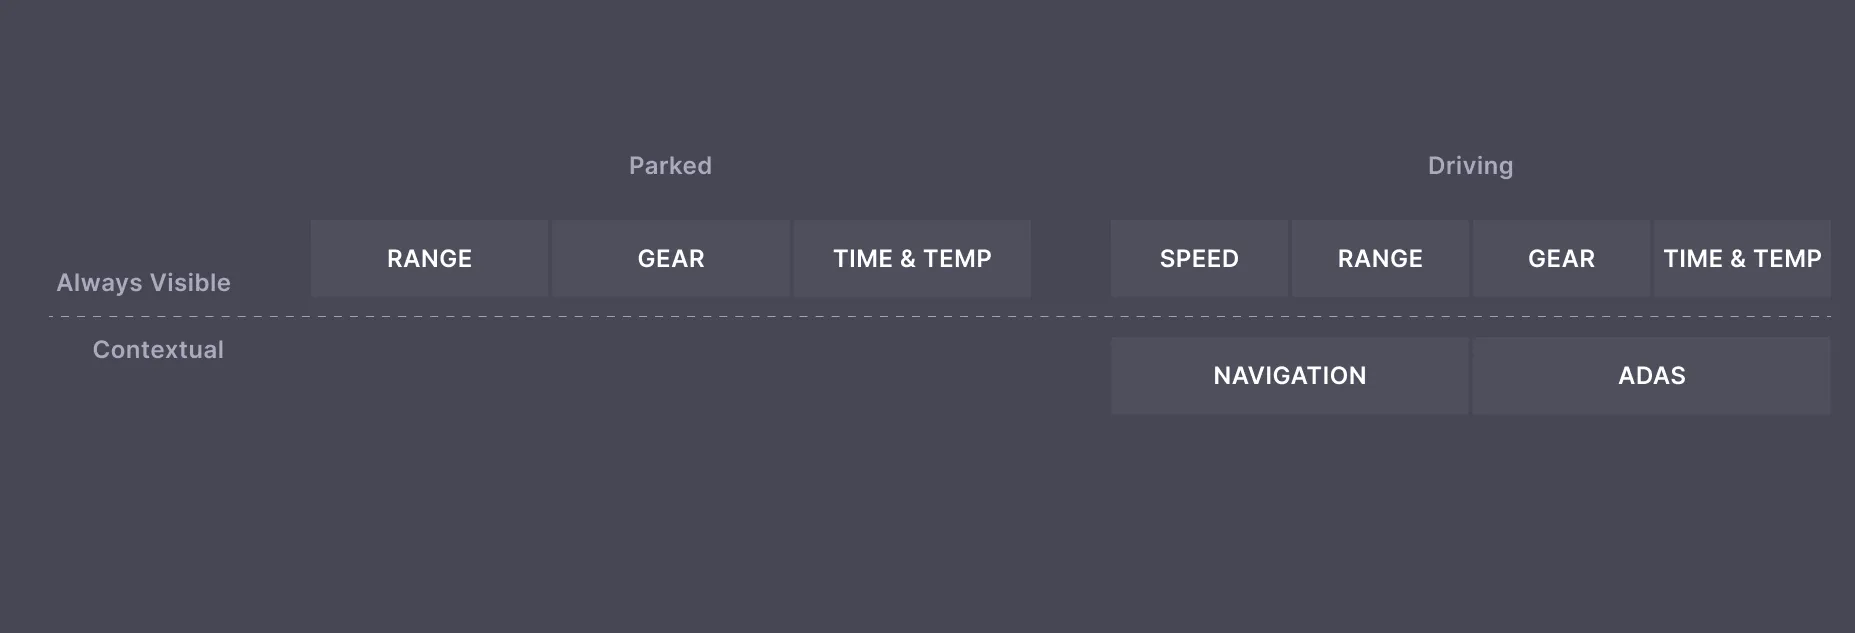
What information should the cluster display?
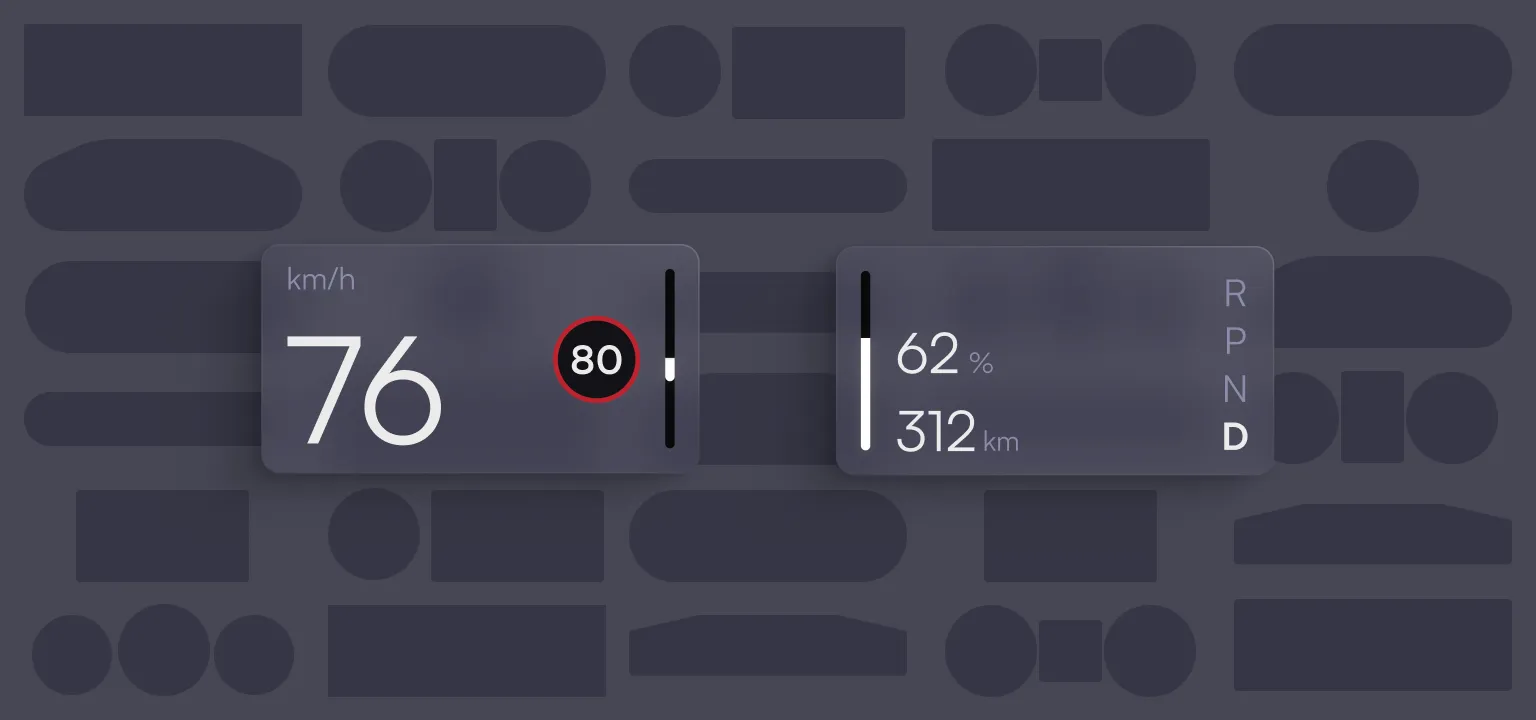
When researching what information to display, I discovered that only little information is actually crucial to the driver. Two subjects are most important: speed and charge level. Speed includes current speed and the speed limit. For charge information, it’s important to display the remaining charge in percentage and range. A 50% charge can have a different range depending on conditions. Similarly, an estimated range of 100km can mean different things if there is 10% or 90% left.
Next to that, there are three more crucial pieces of information: the selected gear, the time, and the outside temperature.
This information must remain visible at all times though different contexts may alter the layout and importance. You could already design an instrument cluster with this. However, two additional types of information might be relevant.
Striking the right balance
Digital instrument clusters today are overly complex because of a lack of physical constraints. However, this lack of constraints is also a great advantage. It opens the doors to display dynamic, and more complex information depending on context. It’s not the fact that instrument clusters are digital that is the problem, but the design.
The point of an instrument cluster is to show glanceable, timely information near the driver’s line of sight. Its power stems from peripheral vision, alerting drivers to warnings or speed limit changes even when not looking directly at it. Thus, the cluster must balance drawing attention with distraction. In my opinion, two examples illustrate this challenge to find the right balance.
Navigation is the first consideration. Displaying route guidance in the cluster is beneficial as it’s easier to glance at than the center display. However, a constantly moving, complex map in a driver’s peripheral vision might be too distracting.
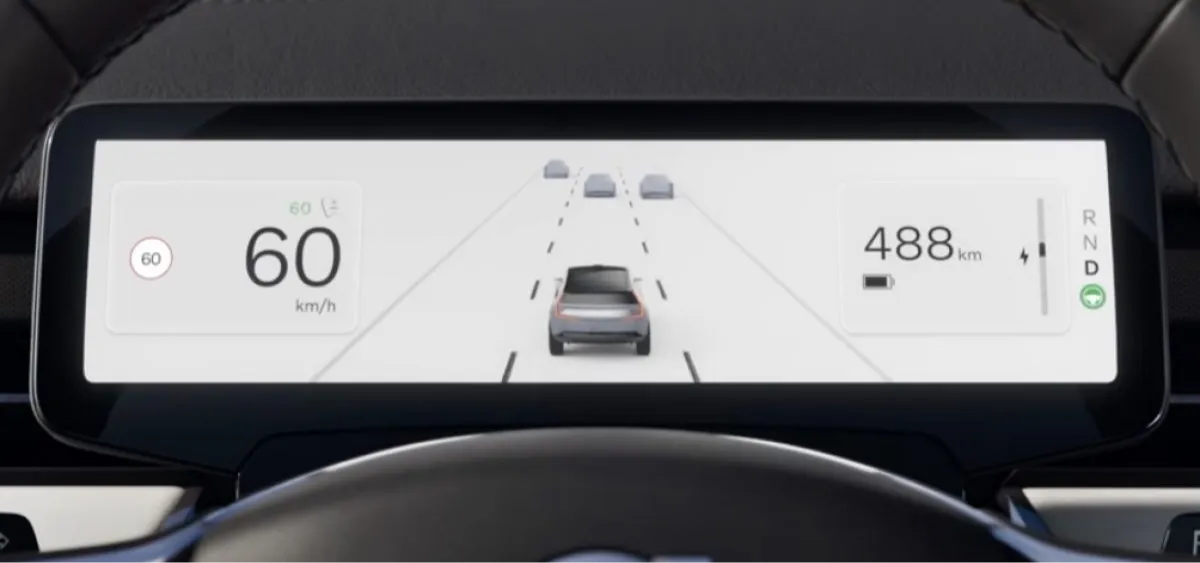
The second example is advanced driver assistance systems (ADAS). It seems like it’s an unwritten rule that every car with ADAS must have a visualization of the car’s sensor data.
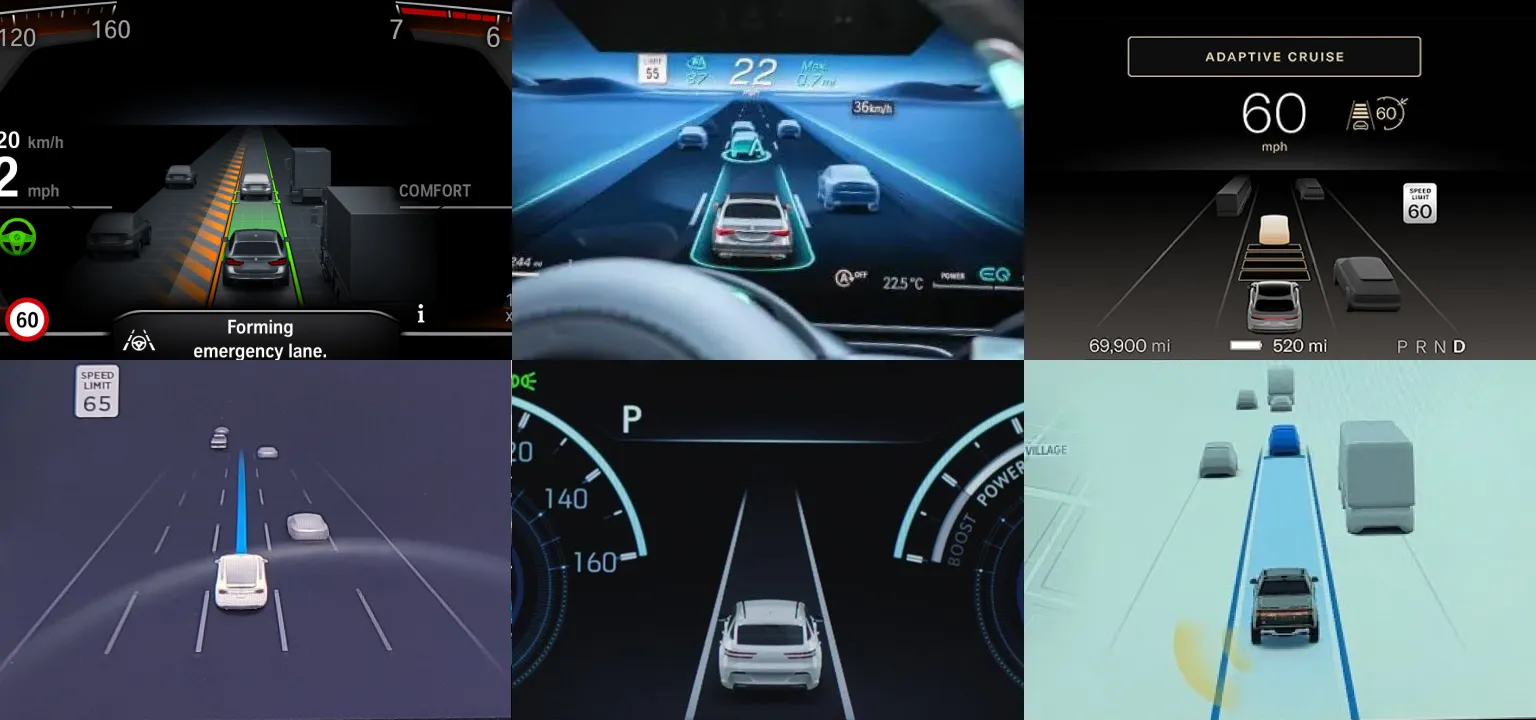
From my experience, many infotainment system features exist not because they solve a driver’s problem, but because one carmaker began it and then all others must too. I haven’t witnessed another industry where copying every feature of a competitor is standard process. I strongly feel it’s the same for ADAS visualizations. On the other hand, they help build trust by showing the car’s perception and decisions, such as during automatic lane switching.
How to find the right balance in this case? During partially automated driving, drivers should keep their hands on the wheel and observe their surroundings. Can a driver monitor both the road and instrument cluster, thus reducing danger? Since sensor data is often inaccurate, is it right to show this even though drivers may falsely rely on it? Research on this is inconclusive
I concluded that route guidance information is the least amount of information that will be helpful in the instrument cluster, but I didn’t want to decide on ADAS until I explored some concepts. That’s when I started designing.
The design
First, I created an information architecture. Having a clear and simple hierarchy helps drivers create a mental map of the interface more quickly.
I decided from the start that I didn’t want a configurable instrument cluster. I’d like to it be as simple as possible. If I buy an expensive product, I want the designers to figure out the optimal setup for me. My concept includes different layouts, but they are context-driven. For instance, when enabling route guidance, it displays relevant information in the cluster.
I played with different layouts, settling on a simple structure. I included navigation and ADAS initially, with the option to exclude them if unnecessary.
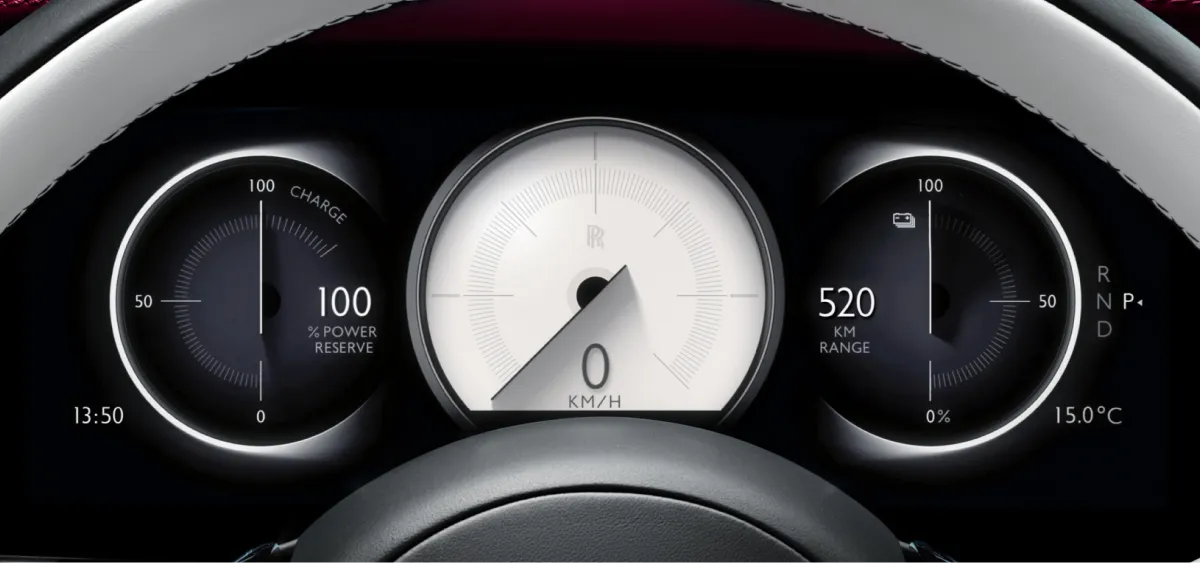
I then focused on specific UI elements. One of my pet peeves is carmakers displaying an analog gauge on a digital screen. Just as I avoid using an analog clock display on my digital watch, I dislike using new technology while adhering to old principles. I understand the choice and its aesthetic appeal, but in my concept, I aim to maximize the digital display’s potential.
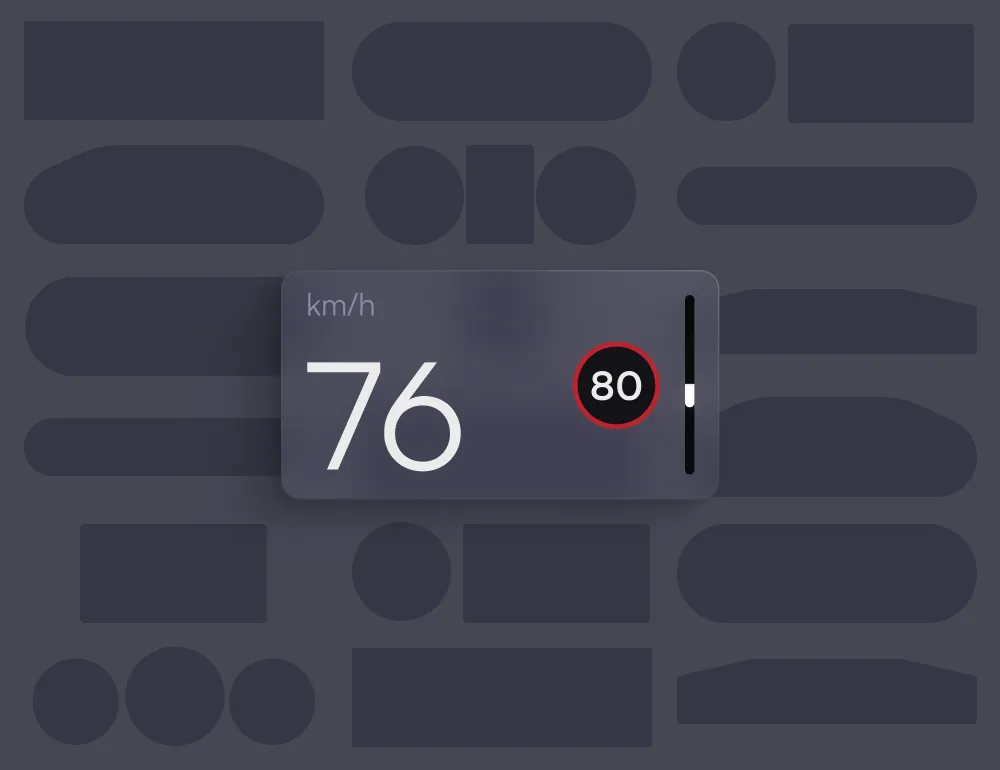
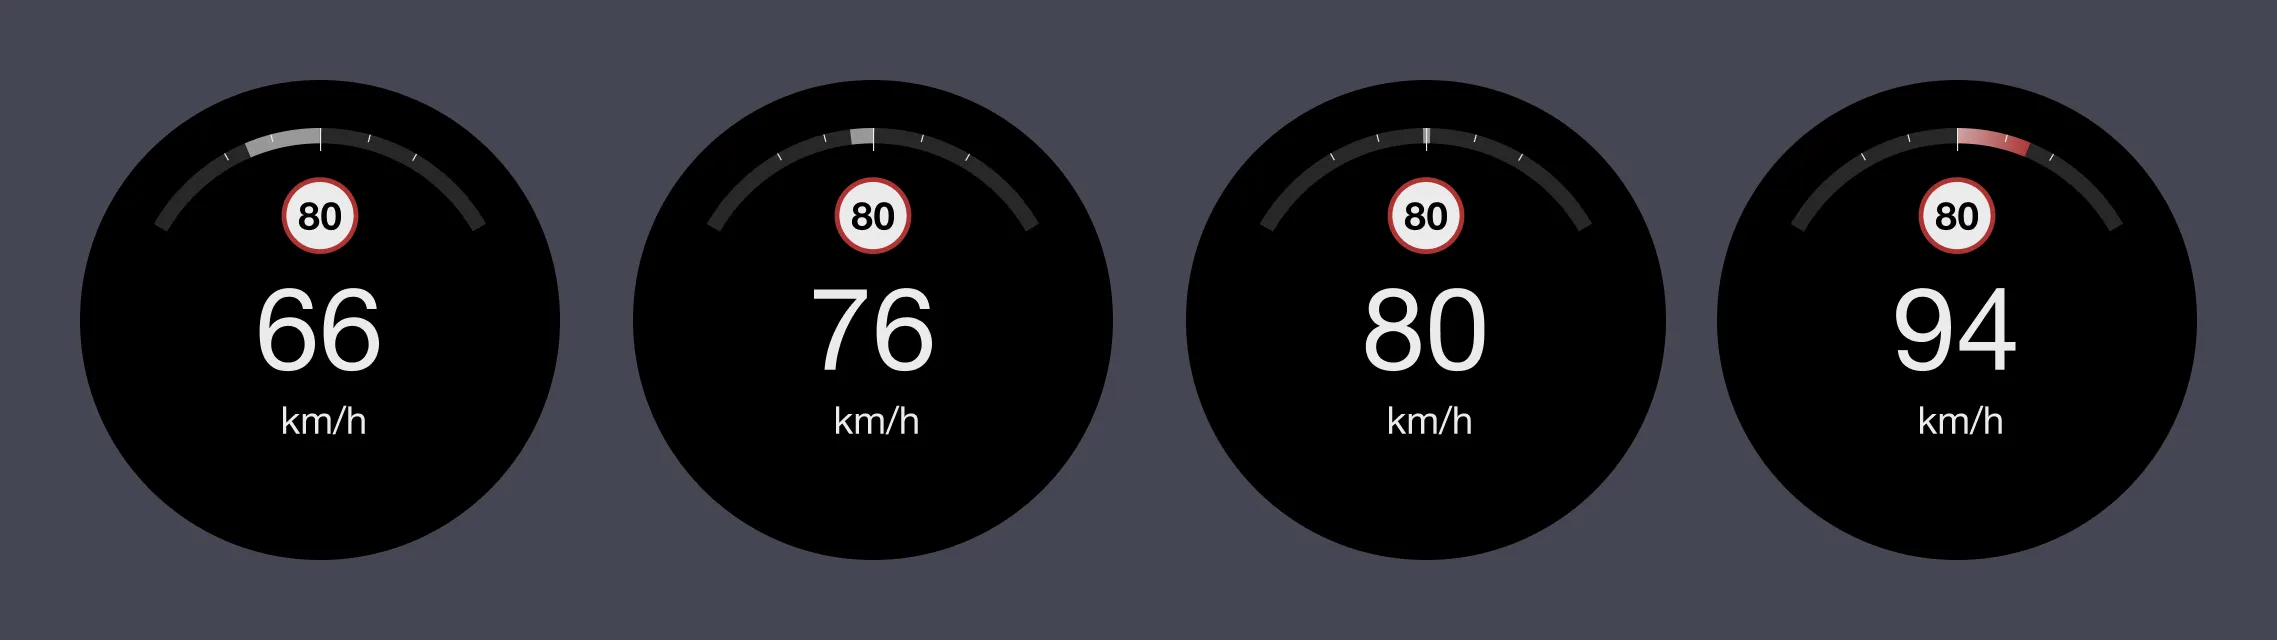
Traditional gauges are great design-wise because they can communicate information through shape and movement rather than letters and numbers, which are harder to read. For speed, I aimed to create a similar glanceable component that drivers can scan in their peripheral vision without looking down and reading.
Merely considering speed is irrelevant for the driver. A better metric is the speed relative to the limit. Thus, I played around with a way to display the speed delta, with an option to emphasize a substantial variance. However, this feature should be subtle, as cars frequently misread speed limits, causing frustration.
To finalize the design of my first iteration, I applied a basic UI theme. Like Porsche, I chose a black background to enhance comfort in the dark. I used orange as the primary color because it helps the eyes adjust to the darkness. Longer wavelength colors such as red and orange have the least amount of impact on our night vision.
Picking a font is always controversial. An often-cited study on fonts’ impact on reading time in cars found that a humanist font, Frutiger, significantly reduced reading time compared to a grotesque font, Eurostile. But even though the reduction in reading time is significant, overall, the difference is minimal. The conclusion that humanist fonts are better than grotesque fonts is perhaps a step too far as the chosen fonts are not the greatest examples of each category. The researchers also did not optimize each font for legibility by adjusting the size, letter spacing, and line height, nor did they take into account the display quality. To me, the font family is not the deciding factor, but how you use it. Thus, I started with Helvetica Neue as a neutral font and changed its characteristics to optimize legibility.
In these early iterations, I omitted ADAS. This concept features just two driving modes: default and navigation. Organizing this information logically is challenging. Here’s a first attempt:
I then played around with more creative ways to visualize the information:
In the end, I settled on a more conventional layout that more easily supports different shapes and features:
Second iteration
The first concept was a great start but had much to improve. In the default view, I disliked the charge information’s prominence, equal to the speed. Also, the speed display resembled a traditional gauge, despite not being one.
Moreover, the navigation mode was just a placeholder. The map was too busy and didn’t include any route guidance information. I therefore used Mapbox Studio to create a less distracting map, removing unnecessary labels and reducing contrast on everything except the streets.
I also toyed with displaying the map only below a certain speed. At higher speeds, typically on highways, turn-by-turn instructions outweigh the map’s usefulness. Yet in towns, the map is essential for locating streets or destinations.
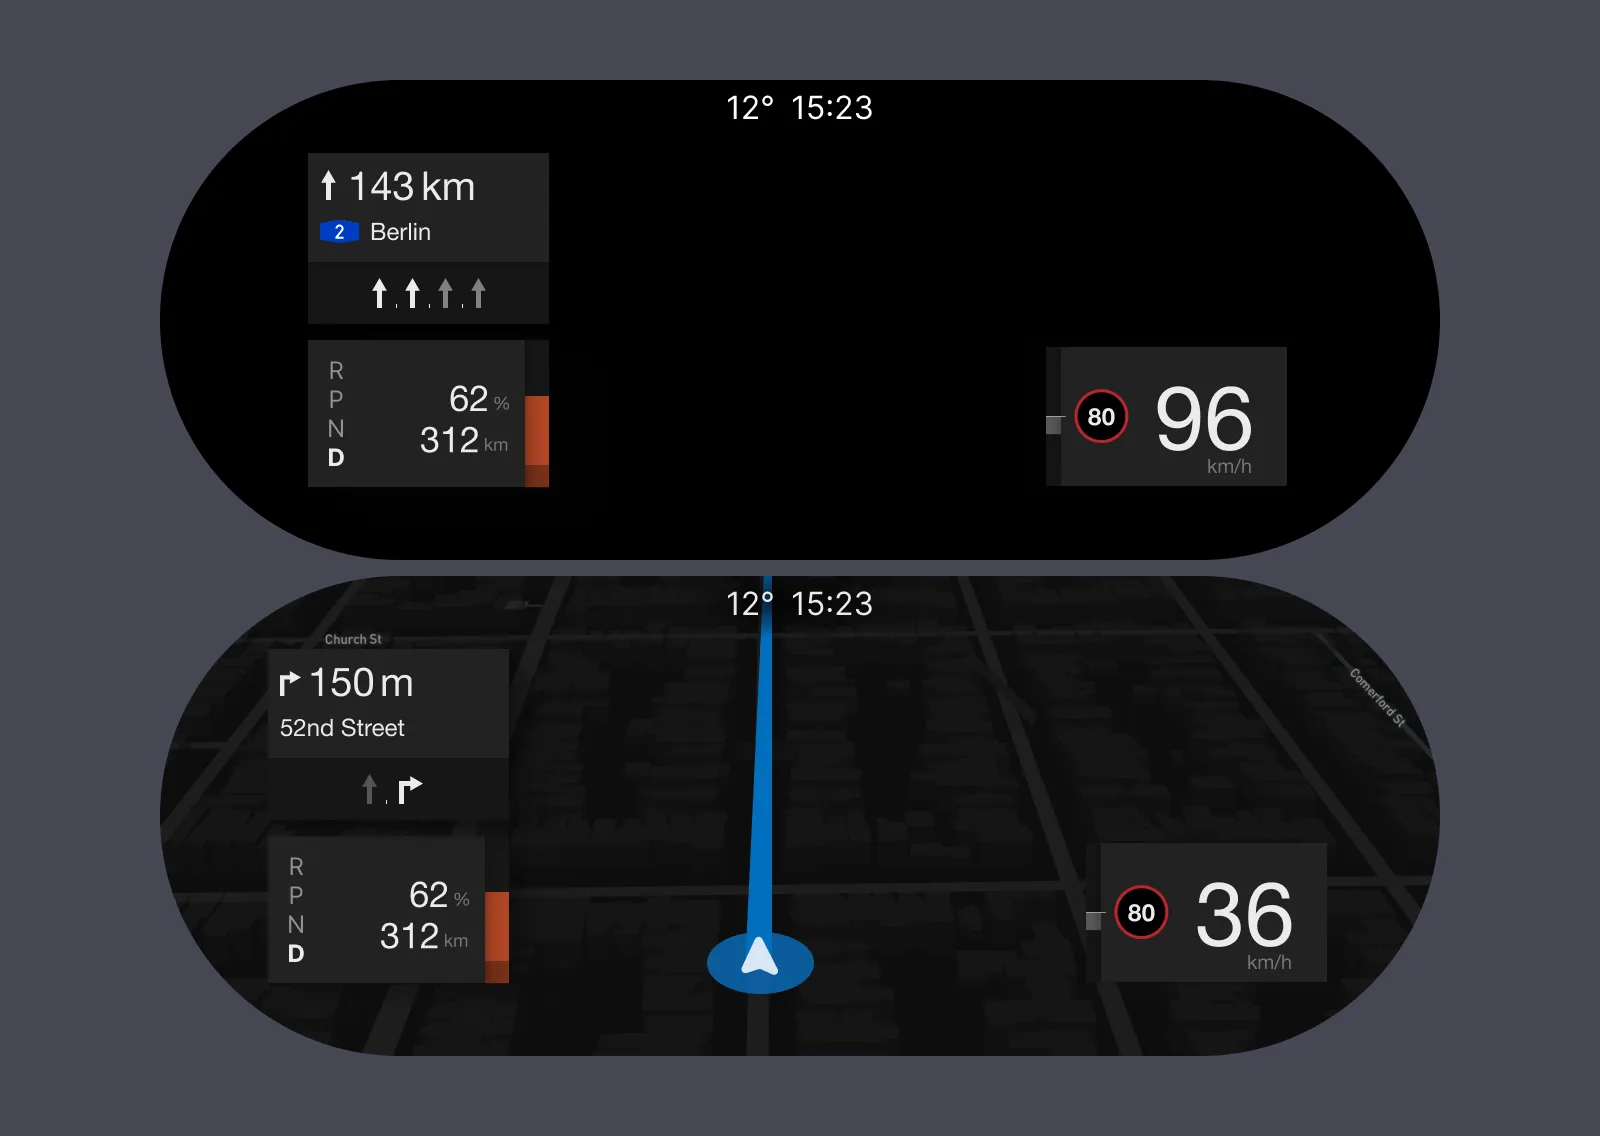
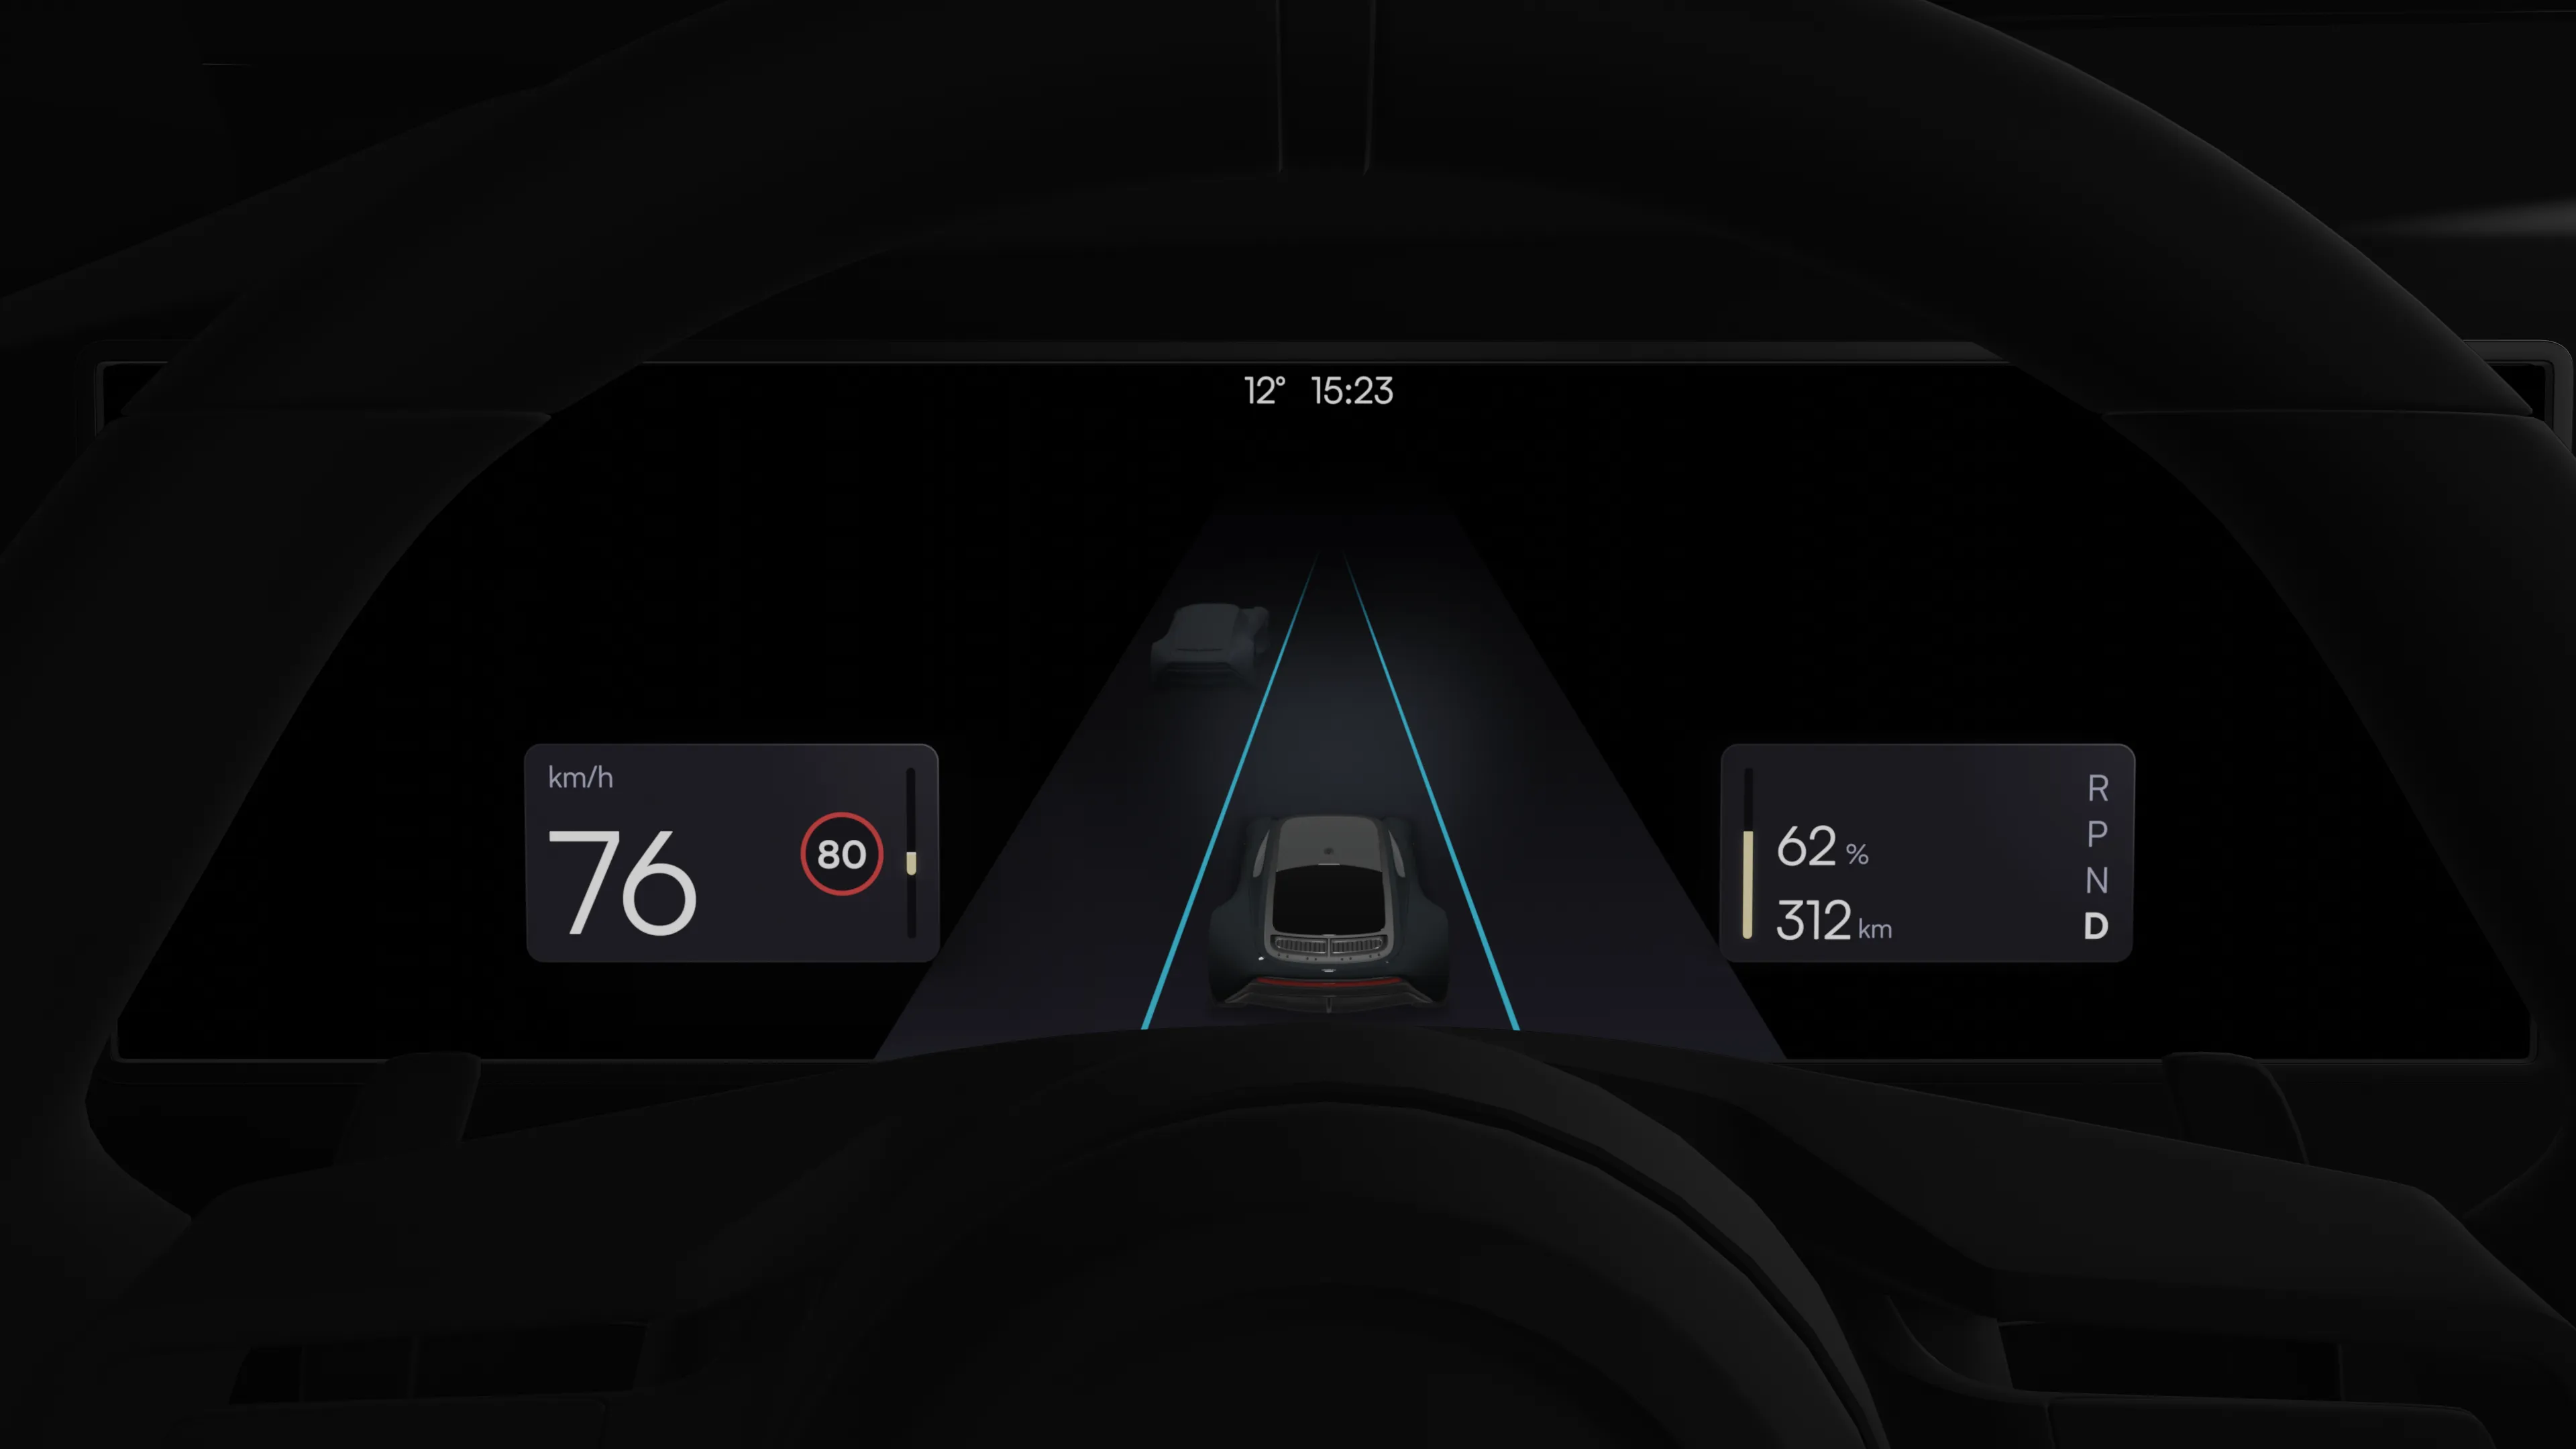
Lastly, I reversed my position on ADAS. Having driven cars with various assistance systems, I remain skeptical about the importance of an ADAS visualization unless the car makes a decision and must inform the driver. For instance, vehicles making automatic lane changes should display this to the driver. However, the default visualization may be too detailed. I used it in my concept due to time constraints but it’s something I will explore in the future.
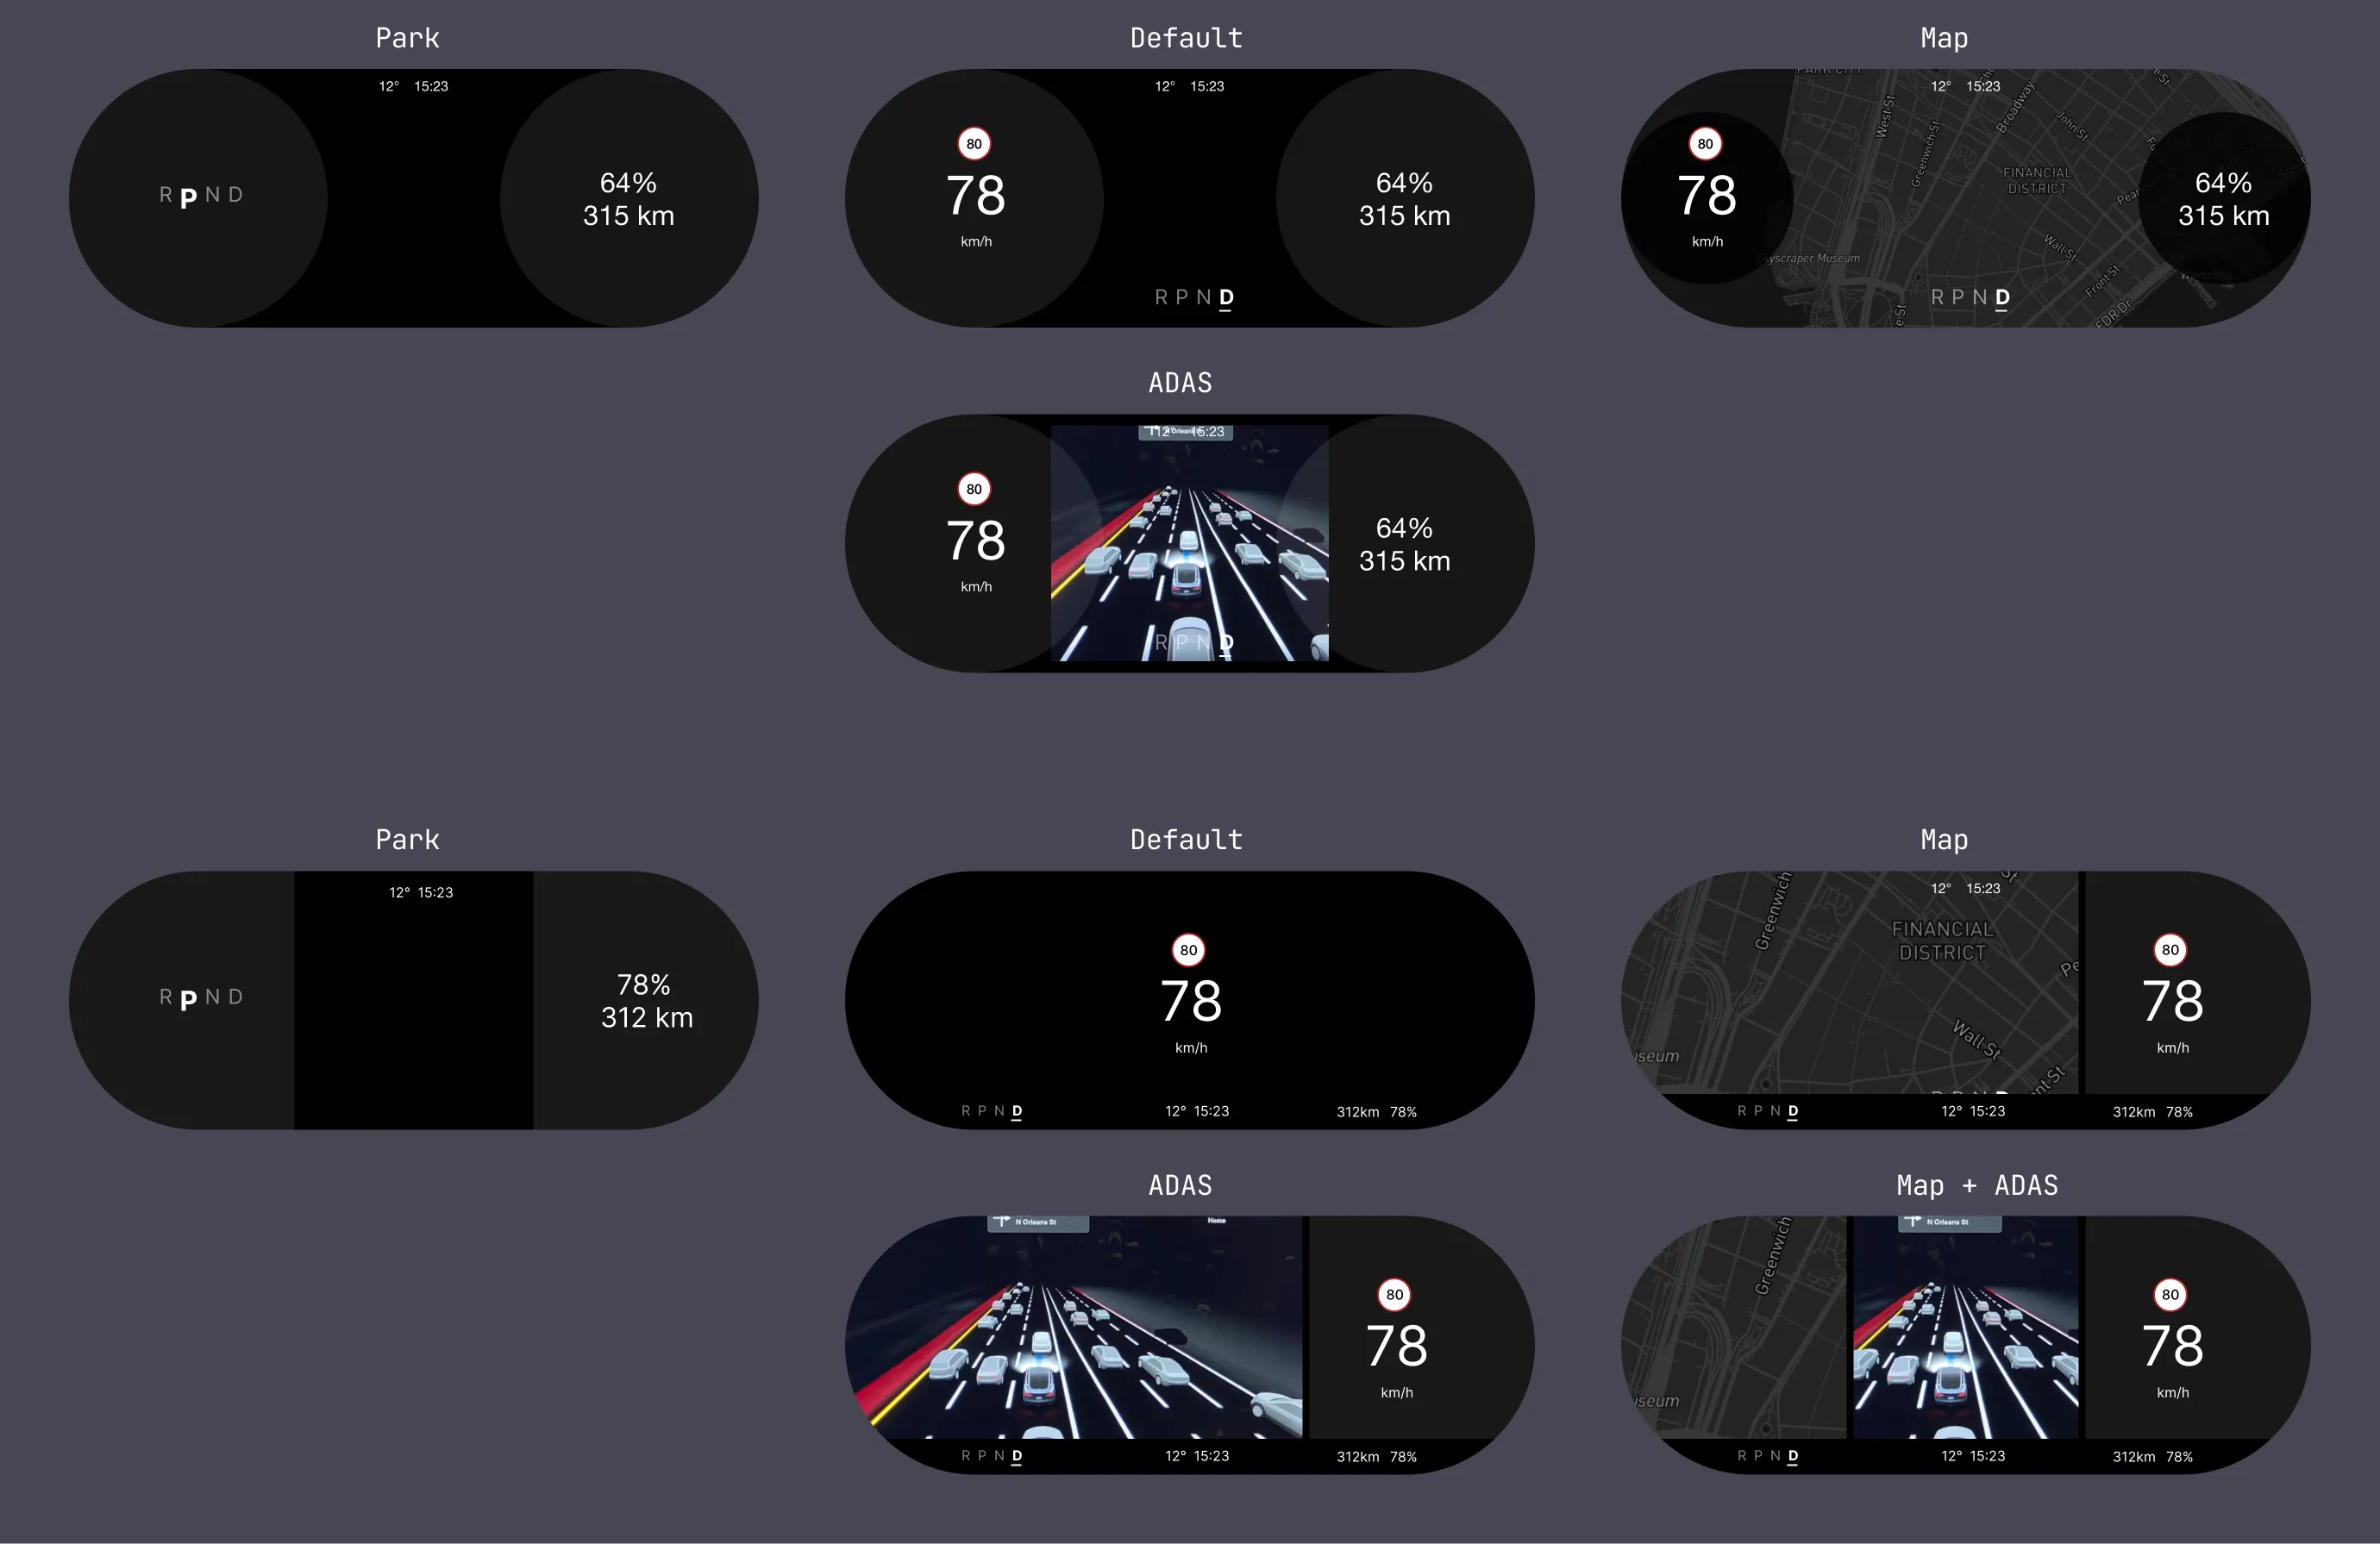
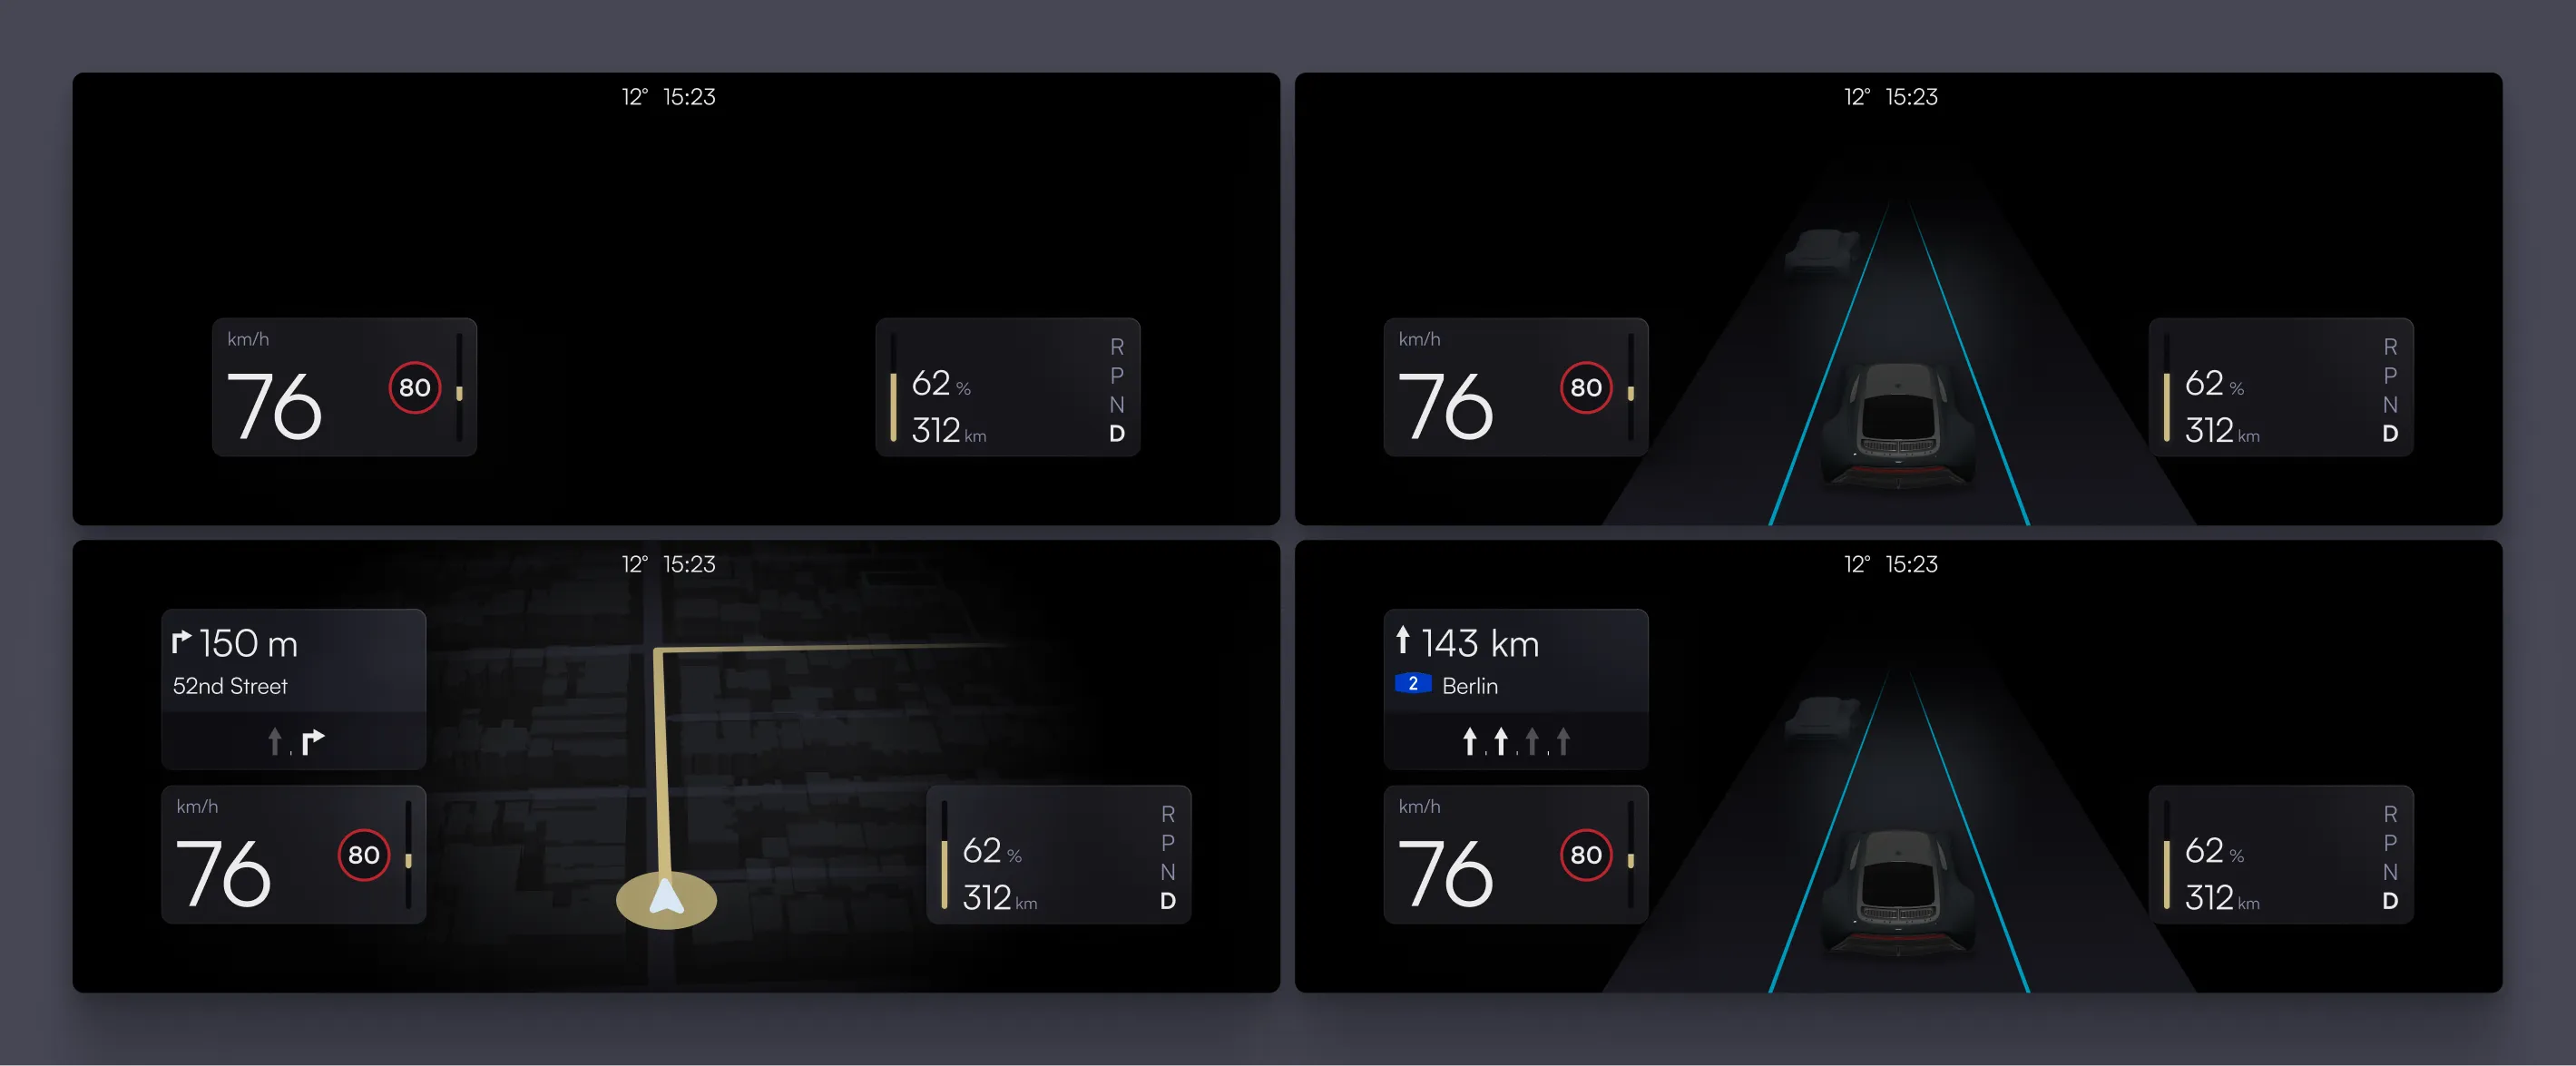
To finish, I wanted to see if my concept would work with different types of branding. So I created a second, more expressive, and elaborate UI theme. Here is the final result:
Here’s the overview of the four different modes:
I gave myself just a few hours for this design exploration and stopped my concept there. Yet, I hope it suffices to convey my thinking and answer whether digital instrument clusters have advantages over analog ones in design: yes, by minimizing features, adapting information to context, and creating an ergonomic UI design, it is possible to create a digital instrument cluster that offers more value than an analog one.
As the concept is not finished, perhaps I’ll resume this project in the future. I’d love to explore ways to create a more abstract ADAS visualization. I also omitted designs for when the car is parked.
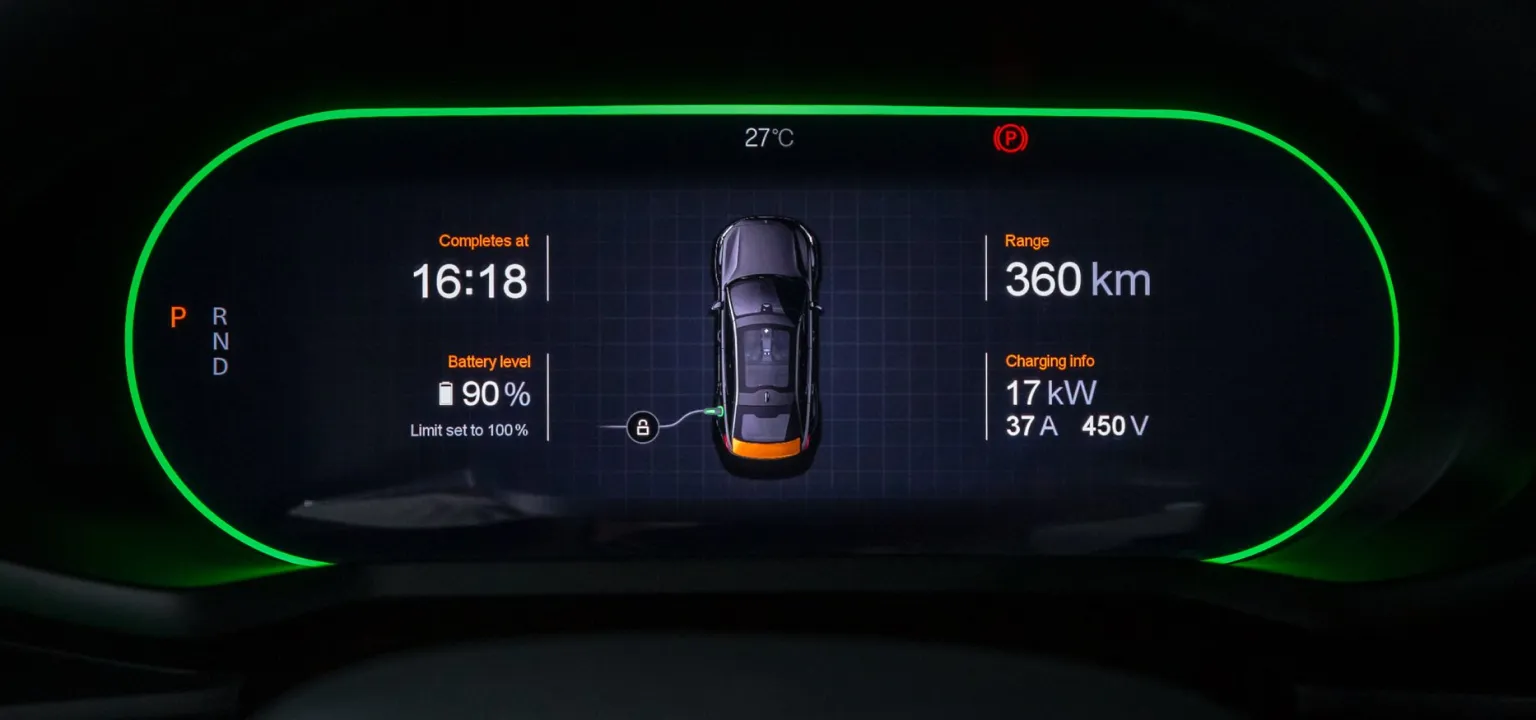
One last thing to add is that after completing this project, I explored existing designs from carmakers and found the Polestar 2. I was generally familiar with its system, but upon closer inspection, the similarities are striking, down to my initial use of orange.
Polestar adapts the cluster to different contexts in a similar way, although controlled by the driver. I love that when parked, it focuses on the battery status, which changes upon exiting to display a clear green outline making it easy to check the status from outside the car.
It’s even striking how my second UI theme is similar to the new generation, to be released in the Polestar 3 and its sibling, the Volvo EX90.
It goes without saying that I really like Polestar’s design.
Get notified of new posts
Don't worry, I won't spam you with anything else